New analysis from My Car Reg Check has revealed where Blue Badges are most widely used across England, highlighting the areas with the highest demand for mobility support.
By breaking down official government data, the study shows that while larger counties tend to record the highest number of Blue Badges overall, it is smaller areas like Sunderland that stand out for having the highest concentration relative to population.
Sunderland tops England for Blue Badge use per head
Sunderland has the highest proportion of Blue Badge holders in England, with 8.3% of its population holding a valid badge.
This makes it the area where Blue Badge use is most concentrated, offering a clearer picture of where the scheme is most relied upon.
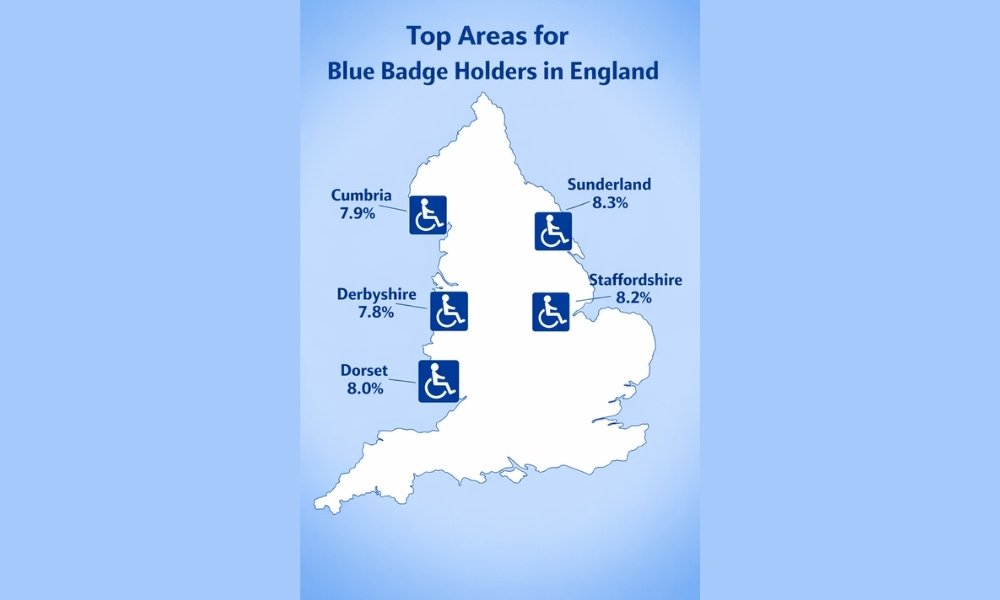
The top five areas by percentage of population are:
- Sunderland, 8.3%
- Staffordshire, 8.2%
- Dorset, 8.0%
- Cumberland, 7.9%
- Derbyshire, 7.8%
Larger counties lead on total numbers
While Sunderland leads on a per-head basis, larger counties dominate when it comes to total Blue Badge numbers.
Kent has the highest number of valid Blue Badges overall, with 92,000 badges. It is followed by:
- Lancashire, 79,000
- Hertfordshire, 78,000
- Essex, 76,000
- Staffordshire, 74,000
This reflects population size, but does not necessarily indicate where demand is most concentrated.
Clear regional divide across England
The data also highlights a clear regional pattern in Blue Badge use.
The North East has the highest proportion of Blue Badge holders overall at 6.1%, followed by:
- East Midlands, 6.0%
- South West, 5.9%
At the other end of the scale, London records the lowest regional figure at 3.5%.
This suggests that Blue Badge use varies significantly depending on location, with some regions relying on the scheme far more than others.
London boroughs among the lowest
Several London boroughs rank among the lowest areas in England for Blue Badge use.
These include:
- Kensington and Chelsea, 2.1%
- Wandsworth, 2.4%
- Lambeth, 2.4%
- Tower Hamlets, 2.5%
This contrasts sharply with areas in the North, Midlands and South West, where Blue Badge use is far more common.
What the data tells us
According to My Car Reg Check, looking at Blue Badge data by percentage of population provides a more meaningful understanding of how widely the scheme is used.
Sarah Jenkins, Head of Marketing at My Car Reg Check, said:
“Looking at Blue Badge figures by percentage of population gives a more meaningful picture of where the scheme is most widely relied upon.
While larger areas will naturally tend to have higher totals, the per-head figures show where Blue Badge use is most concentrated and where demand appears to be strongest.
It is particularly striking to see Sunderland come out on top, as well as the wider regional divide between parts of the North and Midlands and areas such as London. These differences help build a clearer picture of how mobility support is being used across England.”
Why this matters for drivers
Blue Badges play a key role in helping people with mobility issues access parking, services and everyday journeys more easily.
Understanding where they are most commonly used can help highlight:
- Areas with higher mobility needs
- Differences in accessibility across regions
- How demand for parking support varies across England
For drivers, carers and families, it also offers insight into how widely the scheme is relied upon in different parts of the country.
Methodology
My Car Reg Check analysed official Blue Badge data for England at regional and local authority level.
The analysis looked at:
- The total number of valid Blue Badges held
- The percentage of the population holding a valid badge
The dataset covers England only, not the whole UK.
- Source data: https://www.gov.uk/government/statistical-data-sets/blue-badge-scheme-statistics-data-tables-dis
If using this research, please credit My Car Reg Check with a link.a